Data Visualization Services & Consulting
Transform your data into powerful visual narratives
Welcome to Blocksynk, your trusted partner for exceptional data visualization services. With our expertise in cutting-edge technologies and passion for translating complex data into compelling visual stories, we empower our clients to unlock the full potential of their data and make data-driven decisions that propel their success.
Why do you need expertly crafted data visualizations?
In a world flooded with information, businesses need more than mere numbers and statistics — they need a visual storyteller that can unlock knowledge, reveal unseen patterns, and provide actionable insights.
By 24%
Visual language shortens meetings. American Management Association
By 21%
Visual tools increase groups’ ability to reach consensus. American Management Association
By 19%
Visual language improves problem-solving effectiveness. American Management Association
Efficient collaboration and analysis
Data visualization helps organize complex datasets, enabling seamless data sharing and fostering team collaboration for effective problem-solving
Optimized resource allocation
Use visualizations to accelerate data analysis, streamline processes, and uncover areas of waste, ultimately leading to reduced costs.
Data-driven decision-making
Identify relationships between historical and real-time business data, develop accurate predictive models, and make informed decision
Our data visualization services
At our data visualization company, we specialize in providing comprehensive data visualization services and solutions tailored to the unique needs of both enterprises and startups. Our team of skilled data analysts and visualization experts collaborate closely with clients to transform raw data into useful and engaging information visualizations.
Gain a competitive edge with our data visualization consulting services. We provide guidance on the most effective analytics tools and visualization practices, enabling you to drive informed decision-making within your organization.
- In-depth analysis of your business case, datasets, and visualization needs
- Existing tools and capabilities assessment
- Customized visualization strategy development
- Design suggestions for interactive dashboards
- Consulting on the most suitable data visualization tools
- Training sessions to enhance your team’s data visualization skills
Our team of data analytics professionals create visualizations that effectively communicate your data, enhance and simplify information perception, facilitate result interpretation, and enable collaboration.
- Definition of core metrics and insights to be visualized
- Appropriate visualization techniques selection based on the nature of the data and the desired outcomes
- Custom dashboard prototype design
- Interactive features development for data exploration and analysis
- Strategy development for seamless integration into existing software infrastructure
We implement data visualizations to transform your complex data into actionable insights. Easily and intuitively explore and analyze your data, grasp key trends at a glance, and make informed decisions for your business.
- Robust infrastructure development and data integration support
- Diverse data sources connection
- Visually appealing and intuitive data dashboards and reports creation
- Data visualization tools configuration
- Visualization optimization for different devices and screen sizes
- Usability testing, feedback evaluation, and improvements
We offer continuous support and maintenance services to ensure that your data visualizations remain up-to-date, accurate, and aligned with your evolving business needs and requirements.
- Data visualization monitoring to prevent disruptions in data analysis
- Issue diagnosis and troubleshooting to minimize downtime
- Performance optimization
- Data visualization software scaling for larger datasets and real-time data updates
- Data visualization technology updates and data security
Our data visualization consultants will guide you through the prominent business intelligence platforms such as Power BI and Tableau. We help organizations leverage their capabilities effectively and empower data-driven decision-making.
- Analysis of business processes, data environment, and visualization needs
- Existing tech stack assessment and recommendations
- Roadmap and strategy development for Power BI or Tableau implementation
- Expert advice on the optimal dashboard design
- Guidance on security measures, access control, and encryption methods
- Migration from Tableau to Power BI with minimal disruptions

Visualize. Transform. Act
Shift from never-ending reports to a dynamic and impactful narrative that drives understanding and action.
Our expertise in data visualization across industries
We have a proven track record of delivering impactful visualizations across various domains. Our data visualizations empower businesses to extract valuable insights, make data-driven decisions, and drive tangible business results, accelerating growth and maximizing their competitive advantage.
-
Healthcare
- Oil and gas
- Finance
- Real estate
-
Retail and ecommerce
-
Industry 4.0
-
Education
Healthcare
Visualize patient medical data, identify correlations to improve diagnosis, monitor patient flow and resource utilization, aid researchers in analyzing datasets from trials. All this will help efficiently allocate resources, enable data-driven decision-making, and improve patient care.
Oil and gas
Craft interactive dashboards and visualizations to monitor real-time metrics, identify bottlenecks, and optimize production processes. Visualize geological and seismic data to analyze potential drilling sites and improve exploration success rates.
Finance
Transform disorganized heaps of complex financial data into intuitive dashboards, track key metrics, such as expenses and profitability, in real-time. Visualize risks, analyze investment opportunities, and detect fraudulent activities by identifying unusual patterns in transactions.
Real estate
Visualize asset performance, evaluate property portfolios, extract key market insights, identify emerging trends, and forecast property values and demand. Our expertise will empower you to quickly identify lucrative opportunities and maximize the profitability of your investments.
Retail and ecommerce
Make the most out of your customer data. Gain an understanding of customer behavior and purchase patterns through intuitive visualizations that will help you optimize marketing strategies, manage inventory, personalize customer experiences, and drive revenue growth.
Industry 4.0 / Manufacturing
Enter a new era of manufacturing industry development with our data analytics and visualization services. Monitor KPIs and production, identify performance issues to take quick actions, and visualize supply chain data to improve inventory management and ensure timely deliveries.
Education
Our data visualization solutions empower institutions to gain insights into student performance, effectively allocate educational resources, and make data-driven decisions that support strategic planning and academic success.
How we deliver our data visualization services
At Blocksynk, our data visualization consultants follow a refined methodology to deliver impactful visualizations that provide tangible business benefits. Here's a breakdown of our process:

- 01. Explore and analyze
- 02. Clean and prepare
- 03. Design and develop
- 04. Test and validate
- 05. Deliver and deploy
- 06. Monitor and update
Explore and analyze
We closely collaborate with you to understand your specific needs and goals. We analyze your company's data infrastructure, identify relevant data sources, and determine the key outcomes you want to achieve through visualization.
Deliverables
- Data infrastructure analysis report
- Data requirements specification
- Visualization feasibility analysis
Clean and prepare
Our data visualization experts handle missing data points and outliers, standardize data formats, and ensure data consistency. This guarantees that the resulting visualizations are logical, accurate, and free from bias and errors.
Deliverables
- Data cleaning report
- Standardized data format
- Removed duplicate records
- Consistent data structure
Design and develop
Working together with your team, we select the most suitable visualization tools and chart types. Our data analysts create compelling visualizations and dashboards, adding interactivity to enhance data exploration and understanding.
Deliverables
- Customized dashboards
- Interactive charts and graphs
- Geospatial data visualizations
Test and validate
We gather feedback from stakeholders and end-users, validating the effectiveness and accuracy of the visualizations. Any concerns or suggestions are addressed promptly to ensure that the dashboards meet your goals and provide valuable insights.
Deliverables
- Data consistency checks
- Data validation report
- Clean dataset
- Quality assurance documentation
Deliver and deploy
We set up the necessary infrastructure, integrate the visualization software with your existing systems, and deploy the visualizations in your environment for seamless usage.
Deliverables
- Finalized data visualizations
- Deployed dashboards
- Shared access to data visualization tools
- Cross-platform compatibility
Monitor and update
We continuously monitor the performance and impact of the visualizations, gathering insights and feedback. Based on this data, we refine and optimize the dashboards to keep them aligned with your evolving needs and ensure you derive maximum value from your data.
Deliverables
- User support and maintenance plan
- Performance monitoring
- Regular security assessments
- Integration with new data sources as they become available
Why choose Blocksynk data visualization services
With a proven track record of success stories and vast industry expertise, Blocksynk can assist you with any data visualization project.
We deliver quality
Our data analysts create high-quality, accurate, and bias-free visualizations, transforming your complex data into clear, actionable insights.
We leverage best tools
We utilize the most prominent data visualization tools such as Tableau and Power BI to provide advanced and dynamic visualizations.
We ensure timely delivery
Our team adheres to strict project timelines, making sure that you can start reaping benefits from your data as soon as possible.
Industries, including FinTech
Successfully delivered projects

Top Big Data Compliance, Fraud & Risk Management Company UAE 2023

Top Hadoop Company 2023

Top MongoDB Company 2023

Top Tableau Company 2023

Top Operations Consulting Company UAE 2023
Our featured data analytics projects
Web3 security solution protecting users from scams
PixelPlex developed a web3 security tool that analyzes token information and the underlying chain of smart contracts to warn users about any risks or threats. The tool accurately determines whether the transaction is safe to proceed or if fraudulent activity is involved.
- Robust security solution that empowers users to engage in safe web3 transactions
- Comprehensive token data analysis
- Easy-to-understand reporting of potentially fraudulent transactions
- Notifications about any harmful logic, vulnerabilities, and compromising permissions
Blockchain-based health and fitness app
Our team engineered a blockchain-powered mobile app that integrates user health data into personalized dashboards and provides insights to improve their lifestyle. The app features a reward system to keep users motivated in their journey towards better health.
- Comprehensive questionnaire for customizing care plans for each user
- Analytics tool responsible for collecting and analyzing data about user physical activity
- Data aggregator mechanism that allows users to view and interact with all their medical records from various providers in one place
- Care plans based on the user’s health data, tailored to their individual health needs
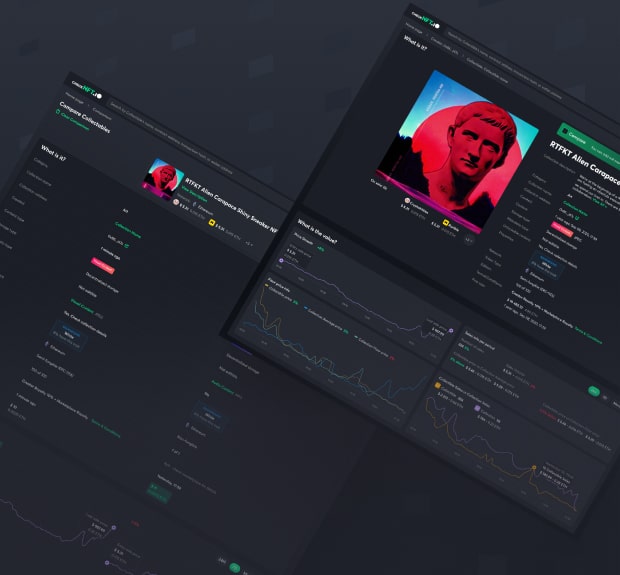
Data-driven BI services for NFT ecosystem
The PixelPlex team developed a cutting-edge platform that leverages advanced analytics to analyze NFT collectibles. The solution helps users mitigate risks associated with token purchases and safeguard themselves against potential scams and financial losses.
- 459K collections processed. * As of August 2023
- Efficient and intelligent data extraction from multiple sources for NFT analysis
- AI-based data analytics tools to track trends and deliver actionable insights
- Risk analysis tools that utilize AI to detect patterns and evaluate scenarios
- High-quality analysis in just a few seconds
Application that connects shippers, carriers, and drivers
PixelPlex created a solution that bridges the gap between shippers, carriers, and drivers and minimizes reliance on intermediaries. Through our application, users can seamlessly connect, set up deals, plan routes, and minimize empty mileage.
- Live-updated dashboard that provides real-time visibility of orders for carriers
- Navigation and reporting tool designed to meet the specific needs of truckers
- Analytics dashboard enabling administrators to track registered users, visitors, registered companies, and paid subscriptions
- Direct and transparent communication between shippers and carriers


